If you’ve ever wondered what it was like for Mama to grow up tall and strong out on the rolling hills and sprawling pastures of her girlhood, these data visualizations get it across perfectly.
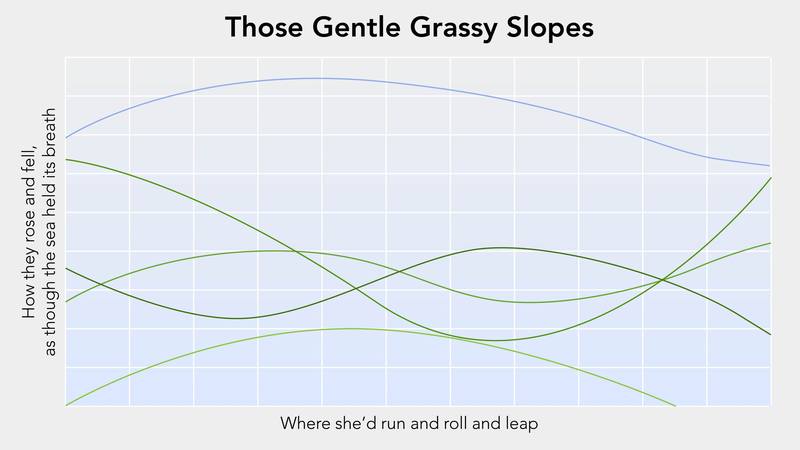
Check out this chart, which clearly conveys those endless, boundless hilltops that echoed with laughter, where Mama played and sang, and learned right from wrong, too:
Wow. Clearly, the rise and fall of the hillsides matches the beating of her young heart. It’s easy to see how Mama would dance atop their peaks, braided pigtails swirling, until the sun painted the sky with purple and gold, and Gran called her in for supper.
But what about the nights, when the sweet scent of meadowgrass lingered in the cool air? Well, we’ve got you covered there, too. Take a look:

As this scatterplot clearly shows, the fireflies swirled in a kaleidoscope of color, setting the summer nights ablaze with their glow. Based on their even distribution, Mama would have had no problem capturing them in a canning jar for a lantern to read her school books by.
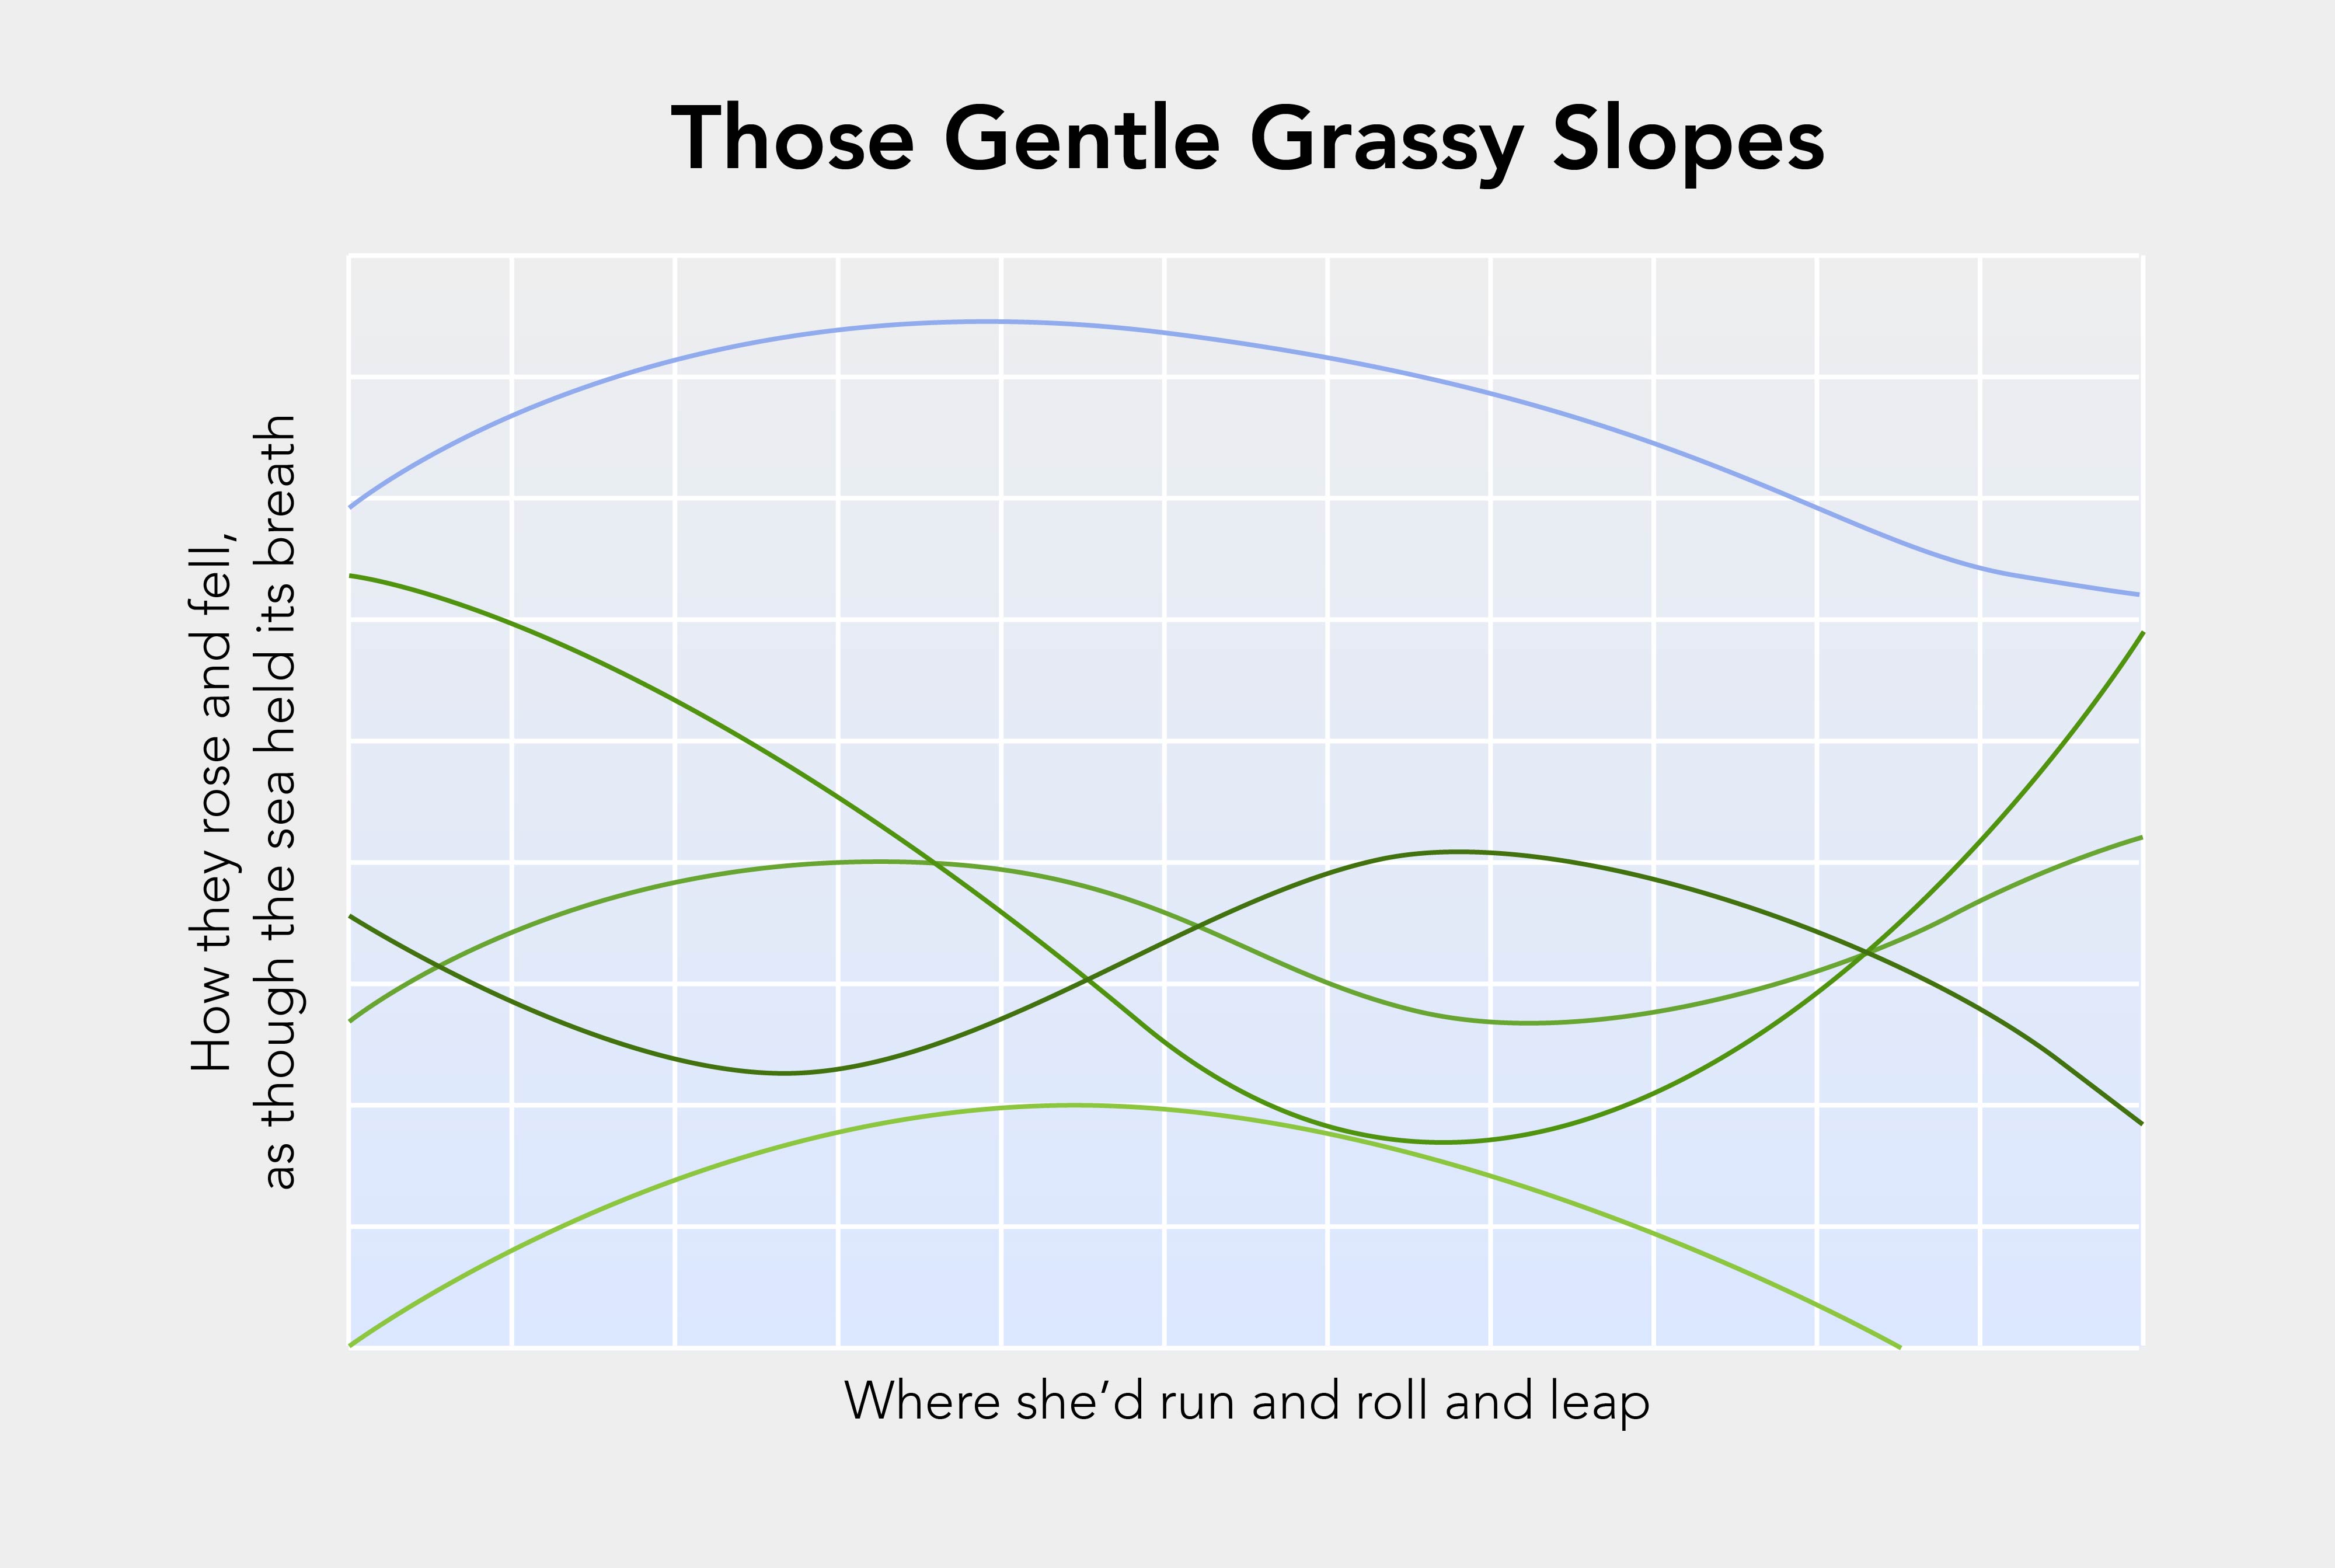
Now, let’s get down to some hard figures. We all know that Mama was raised on good country suppers and that she’d while away long afternoons cheerfully chopping what they’d grown in their little garden plot for Gran’s stewpot or Grandfather’s skillet, but this chart really helps make it all click into place.
The data really speaks for itself: These were humble meals served with love. You don’t have to be a statistician to see how Mama and her sisters were able to keep meat on their ribs and warmth in their bellies, even through the iciest winters.
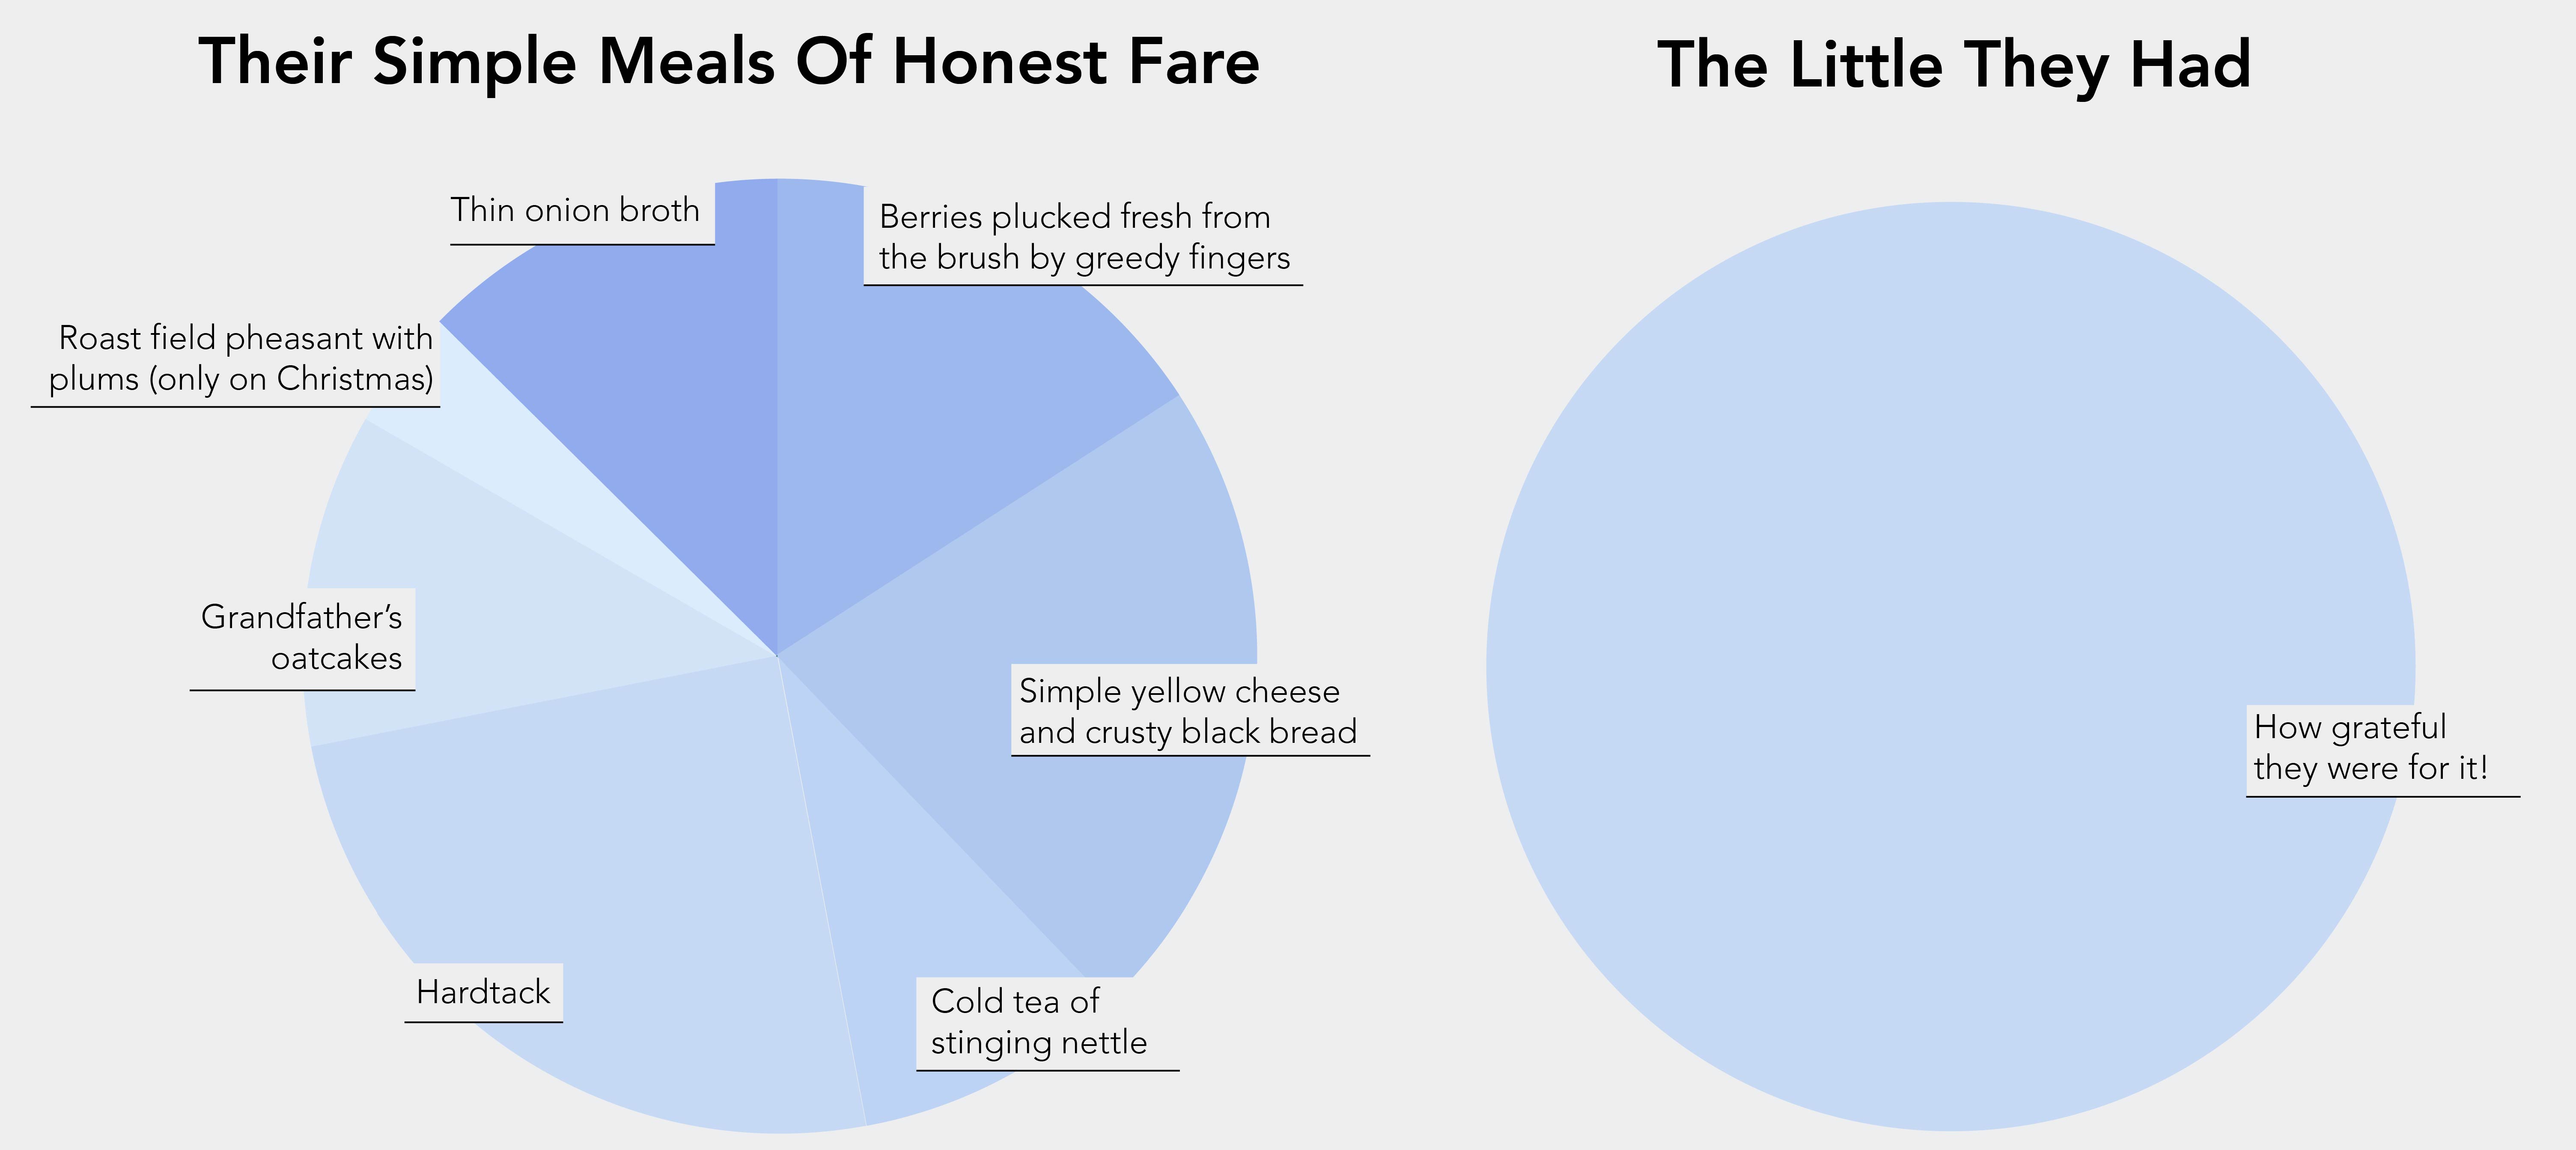
Speaking of winters, with their long, cold claws that not even a roaring woodstove could keep at bay, this graph tackles the thorny subject of the price Mama’s family paid each time that lean, cruel season fell once more.
There’s a lot to unpack here, but the key takeaway is that each loss, grievous though it was, taught Mama a hard lesson about the fickle ways of the world, and what’s more, helped her learn to cherish every prairie sunrise and mountain sunset for the blessings they were. However, don’t overlook the way this graph breaks down why still Mama flinches to this day at a faraway dog’s howl.
At this point, though, you’re probably wondering when we’re going to address Sebastian, the knock-kneed shepherd’s boy from across the valley who grew up so fine and lean. Mama may only speak of him in wistful moments suspended in afternoon sunlight, but this graph goes into it head on.
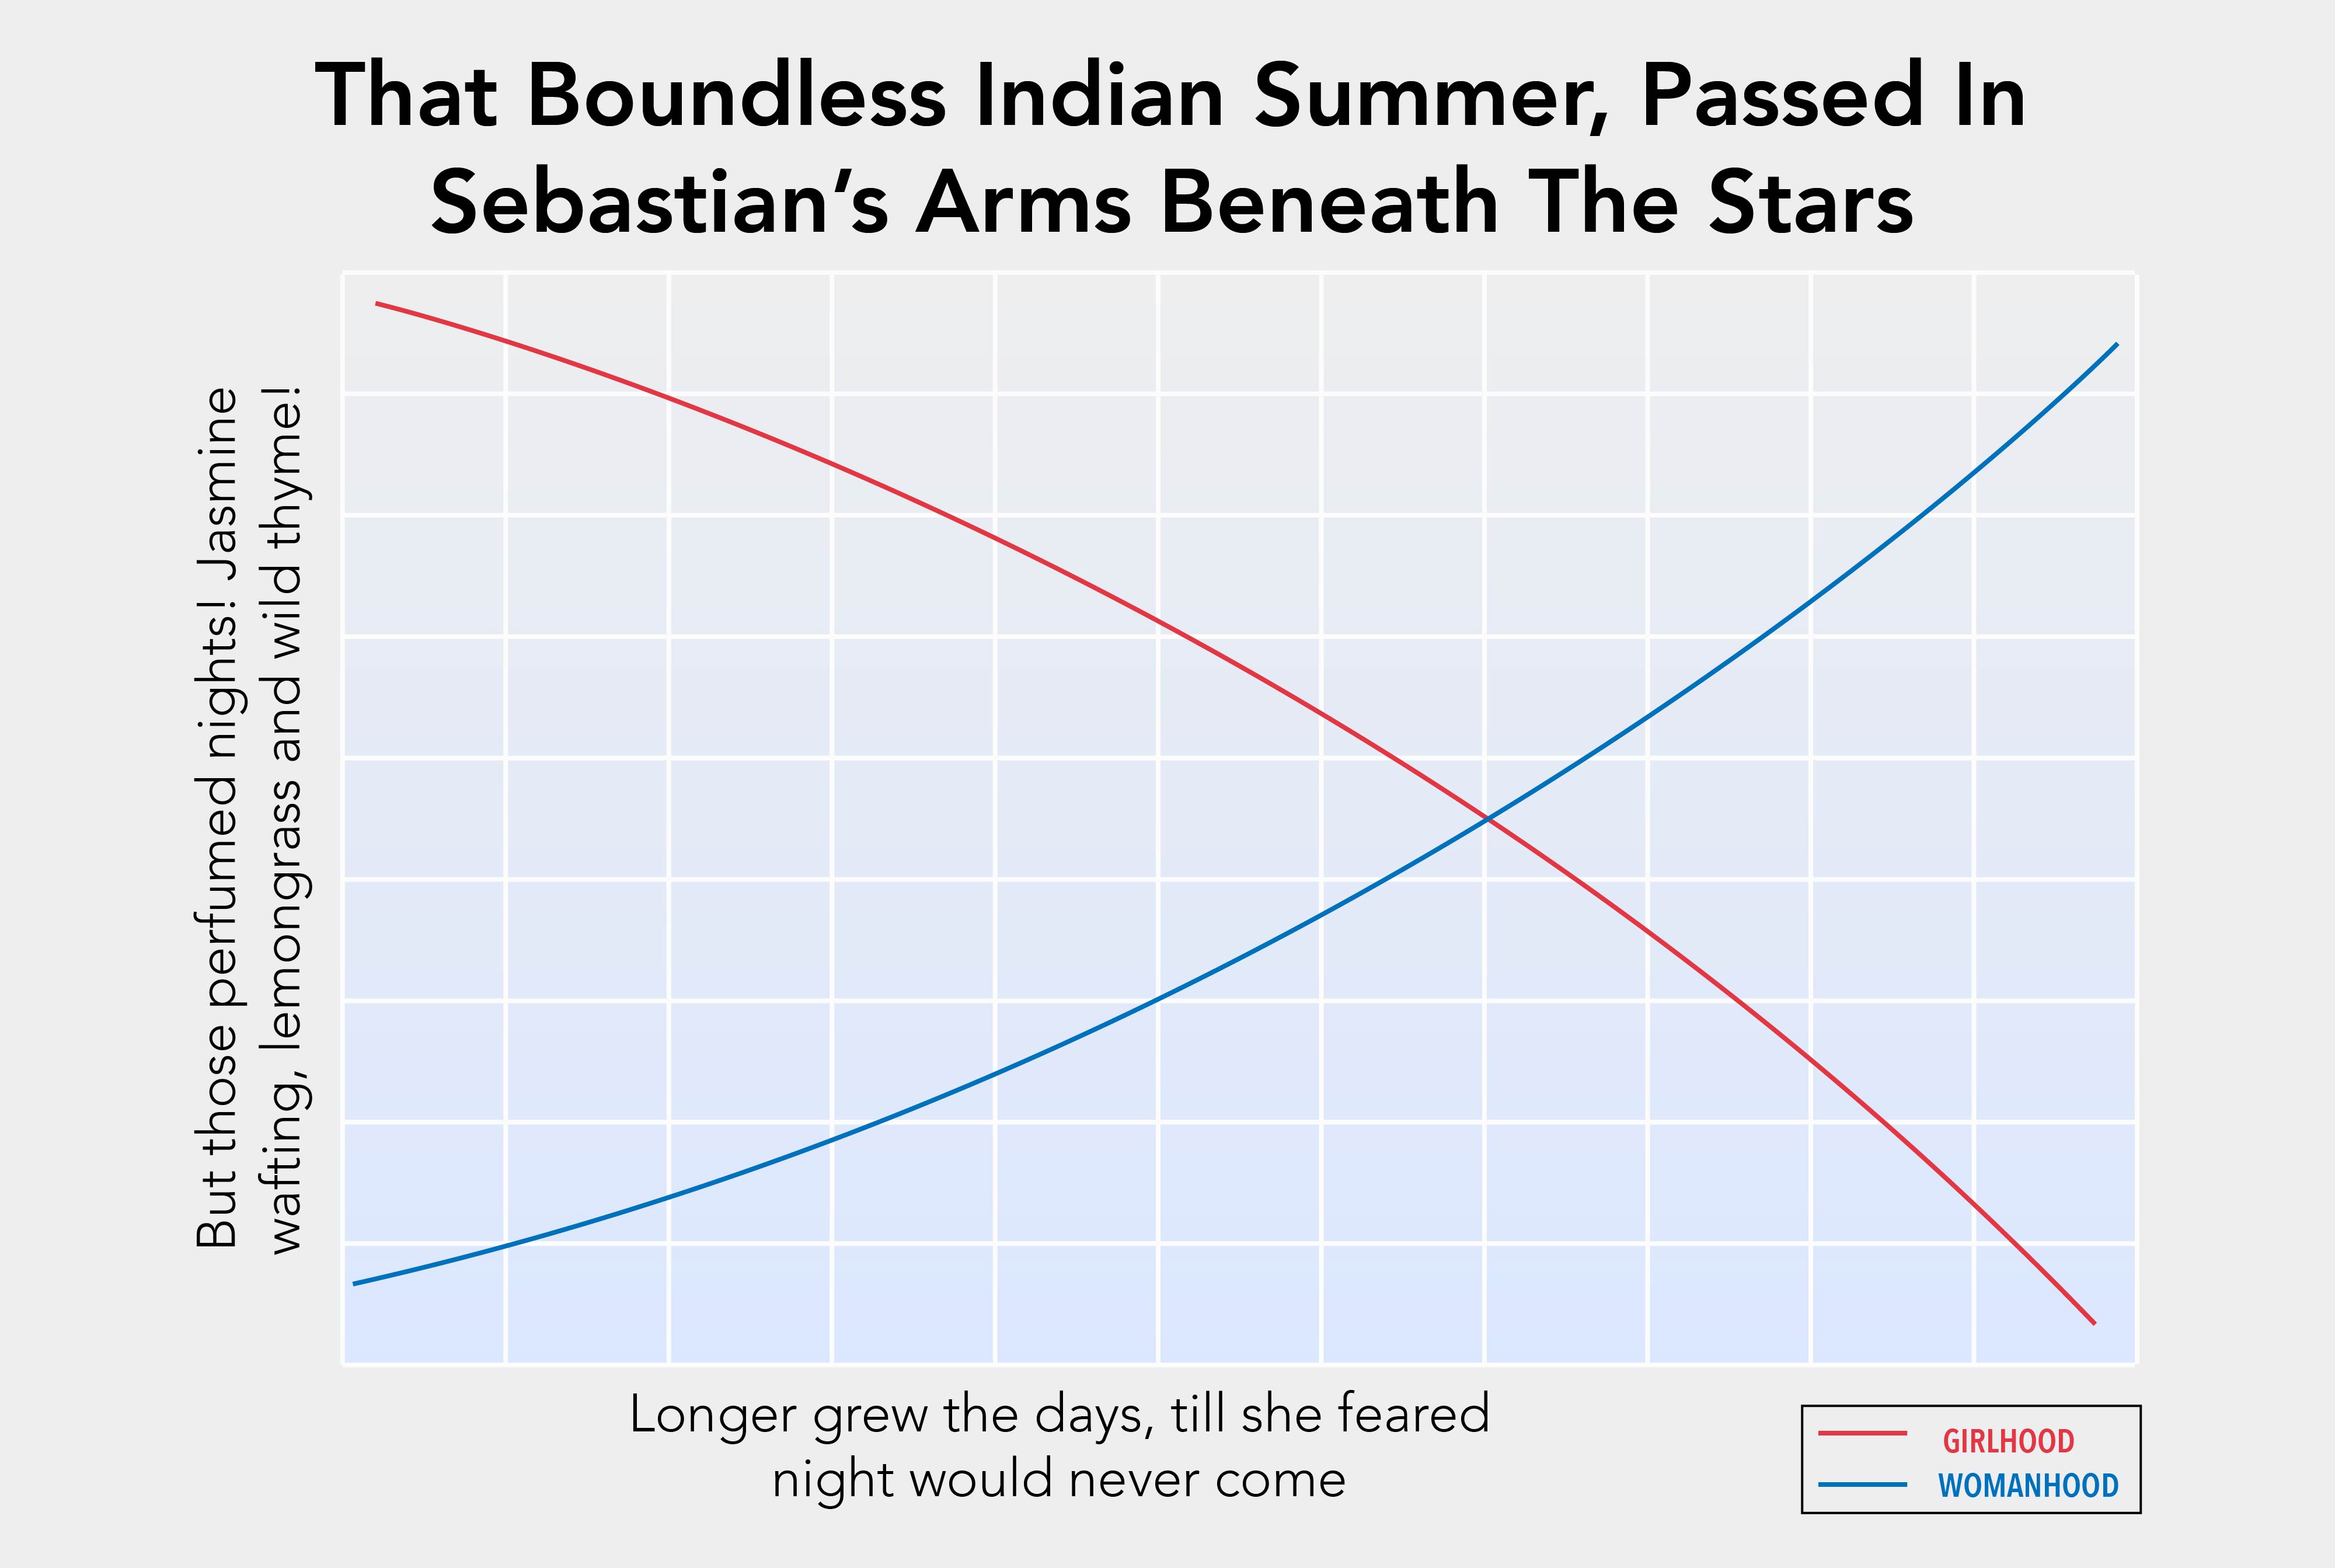
What’s especially cool about this graph is that you can pinpoint the moment Mama entered into the mysteries of womanhood, that vast undiscovered country of delight and sorrow, and from that point on stopped wearing ribbons in her hair. At the same time, though, you can see that she never lost that girlish spark of wonder, nor her hunger for the horizon and what lay beyond.
As far as methodology goes, Mama herself proved an extremely reliable data source, as illustrated by the graph below, for though she’s years and leagues from her girlhood valley, she need only close her eyes to be back among the windswept grass, feeling the sun’s kiss on her ruddy cheeks.
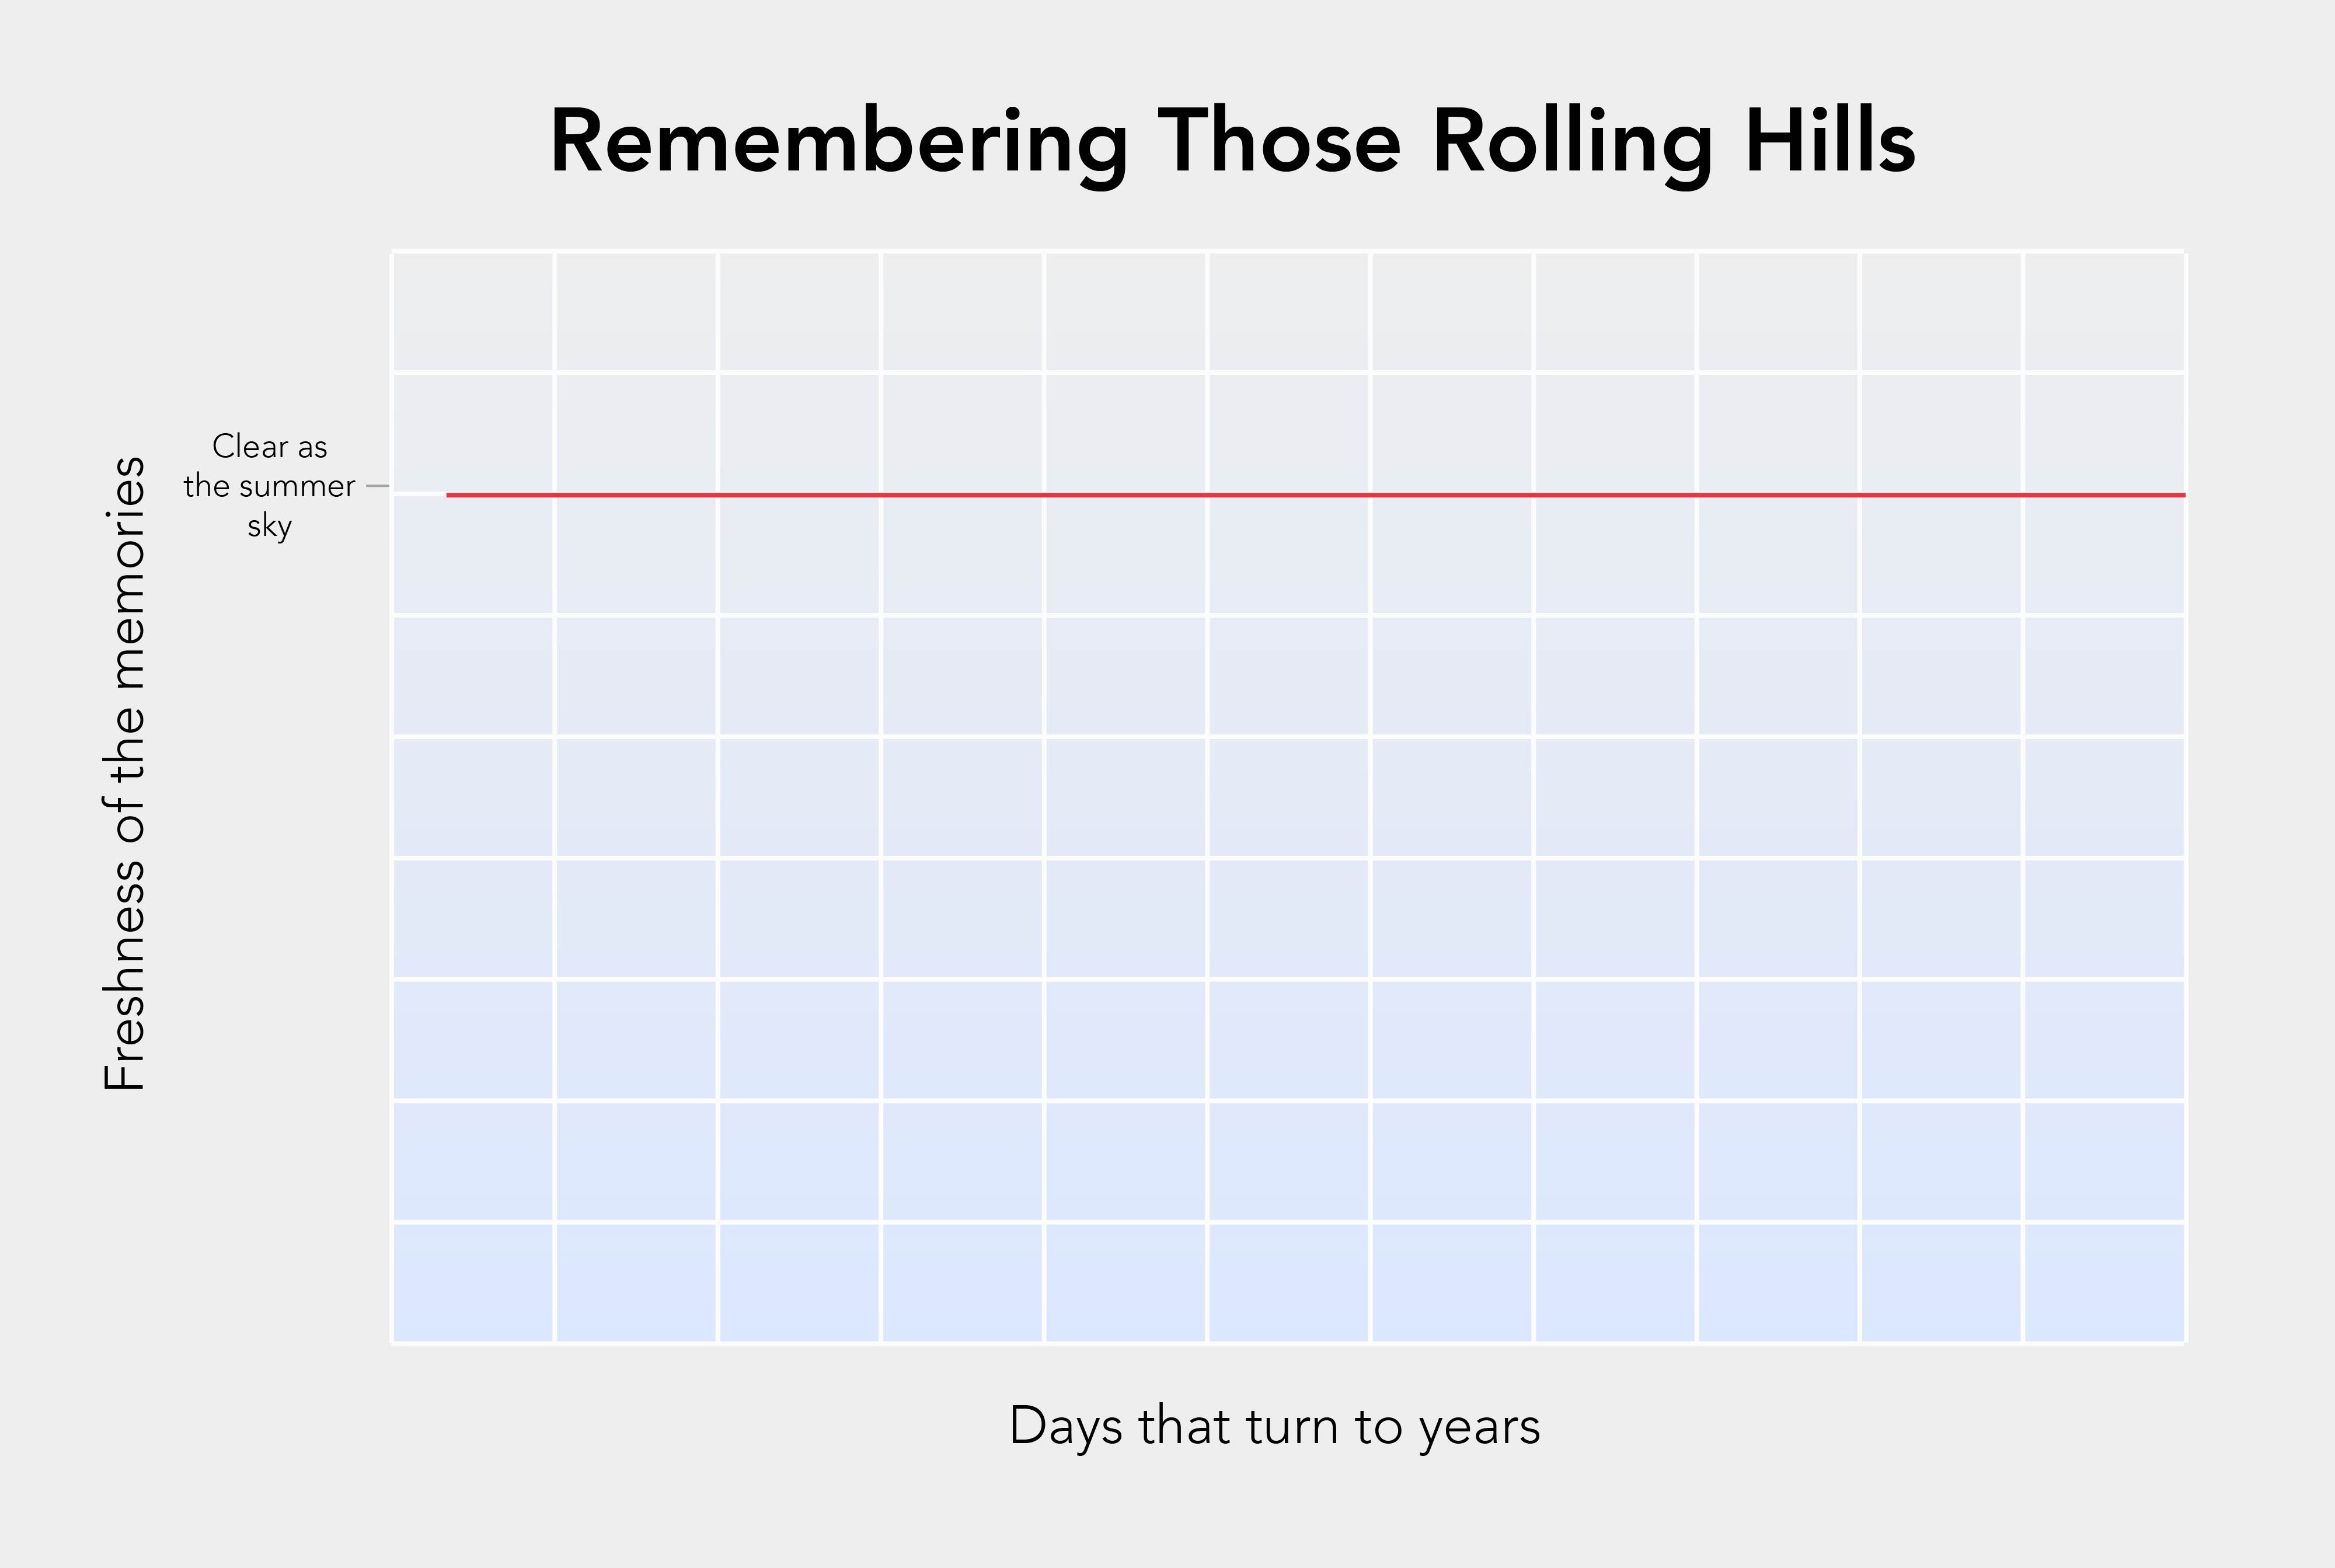
Well, there you have it: the ultimate breakdown of Mama’s country youth. The data show conclusively that the sun-dappled memories of Mama’s halcyon days will echo around those gentle, rolling hills forever. Pretty cool!